
Data insights web application for customer contact centres
Project overview
This operational performance platform required a complete redesign, transforming the customer service data into actionable insights, in order for the client to improve their customer service performance accordingly.
Project type
Call centre agent portal + Call centre team leader portal
My role
UX/UI designer
Industry
Customer service centre
Results
Raised $3.5 million USD in funding

The challenge
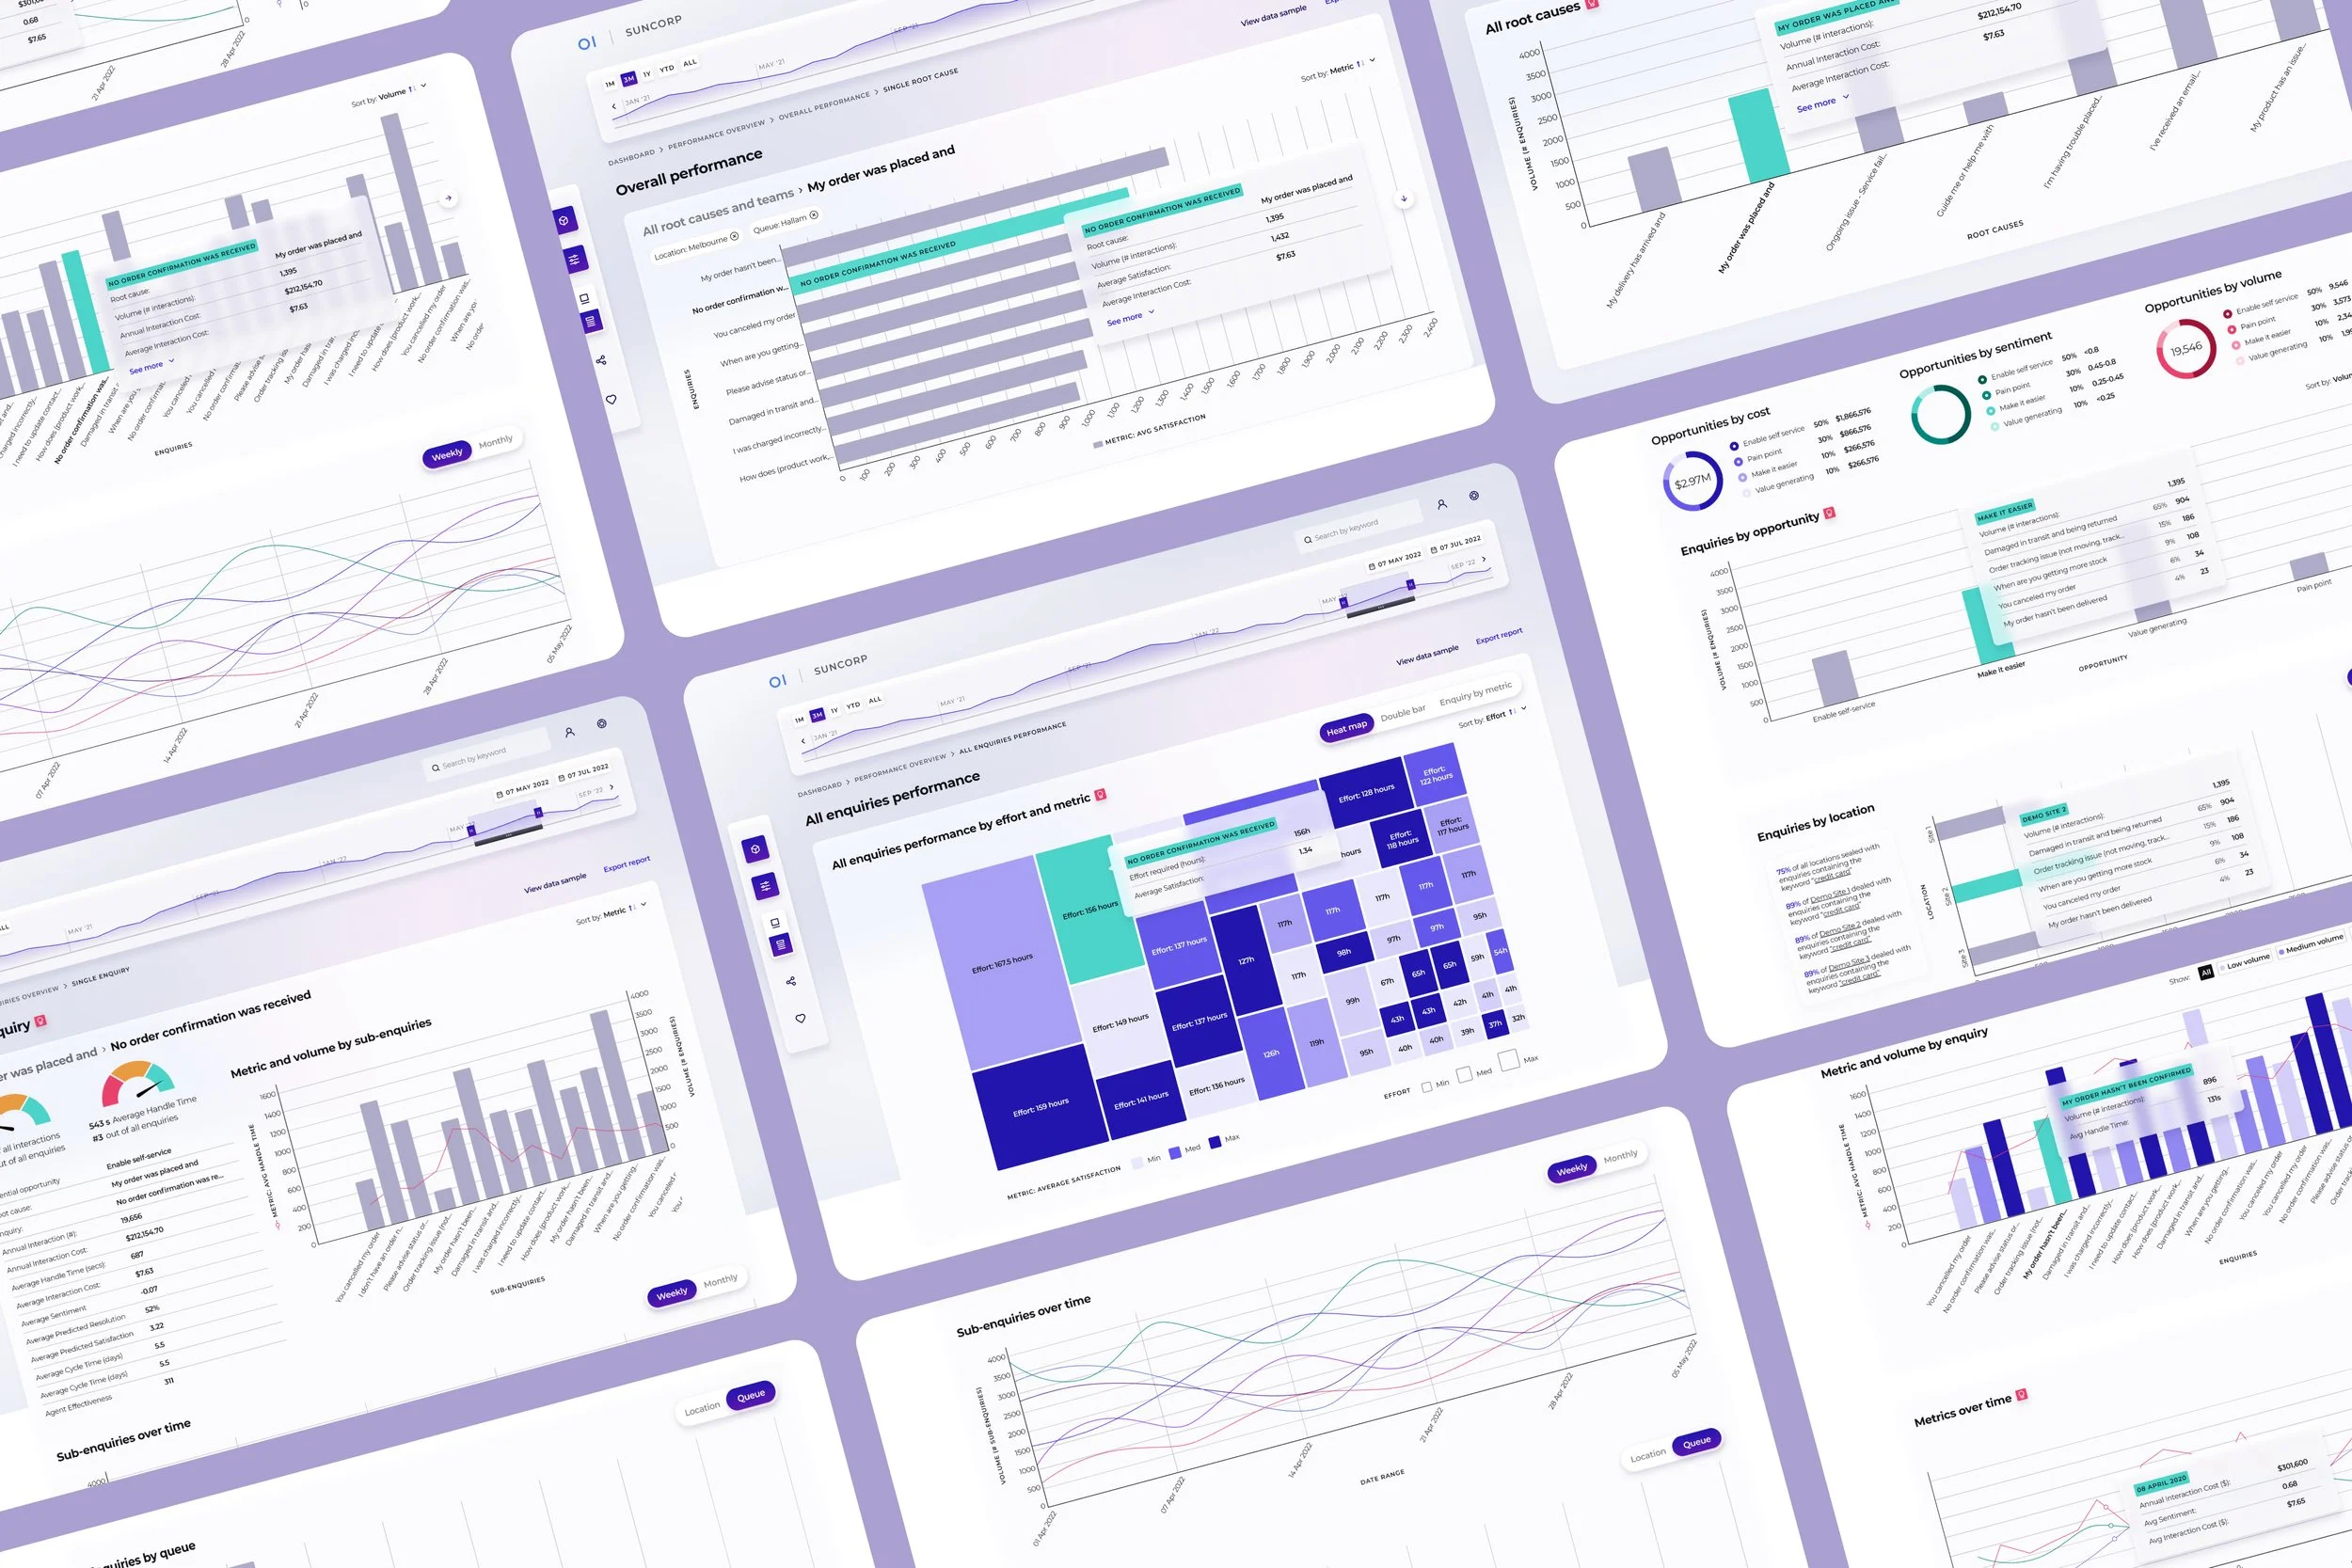
This web app not only needed a complete visual upgrade, it also required a complete user experience transformation. The challenge was to have the user digest large amounts of data in a clean and easy-to-use interface, and turn it into quality, actionable insights, in order for them to improve their customer experience.
The project included a dashboard and web portal for the call centre Agents and the Team Leaders managing them.
Goals:
improve the user experience of the existing performance module
develop an Agent coaching capability
boost collaboration between Agent and Team Leader
Studying the user requirements through user surveys
After studying the current performance flow and doing a competitor analysis to identify existing gaps and opportunities, this stage of the analysis was about evaluating the gathered insights against the actual users’ behaviours, pain points and motivations.
We surveyed the key users Agent and Team Leader to ensure we were designing a solution that worked around their needs and values.
The survey:
What goals do you want to achieve by using this platform?
What are your top 3 pieces of information you come searching for?
How you are currently using the platform on a day-to-day basis?
What are the main roadblocks or pain points you face in the platform?
What changes would you like to see in the platform?

Applying the gathered insights to the designed solution
All the gathered insights and recommendations were organised by short, medium and long term to prioritise what was more urgent/easy to implement first. For the two key users, the main recommendations were:
Team leader dashboard
View all the agents’ performance in the team with timeframe selection tool
Have clear statistics about the team (volume of calls, average score etc)
View which agents are currently receiving coaching and which ones need to undergo coaching
List of all agents with their performance metrics (colour coded for quick insights)
Agent profile
Overview of agent performance and where they sit compared to the team
For each low scoring call, indication of what impacted it (slow response time, unsolved issue etc)
List of all enquiries and my agent score for each with time frame selection tool
Show ongoing coaching progress
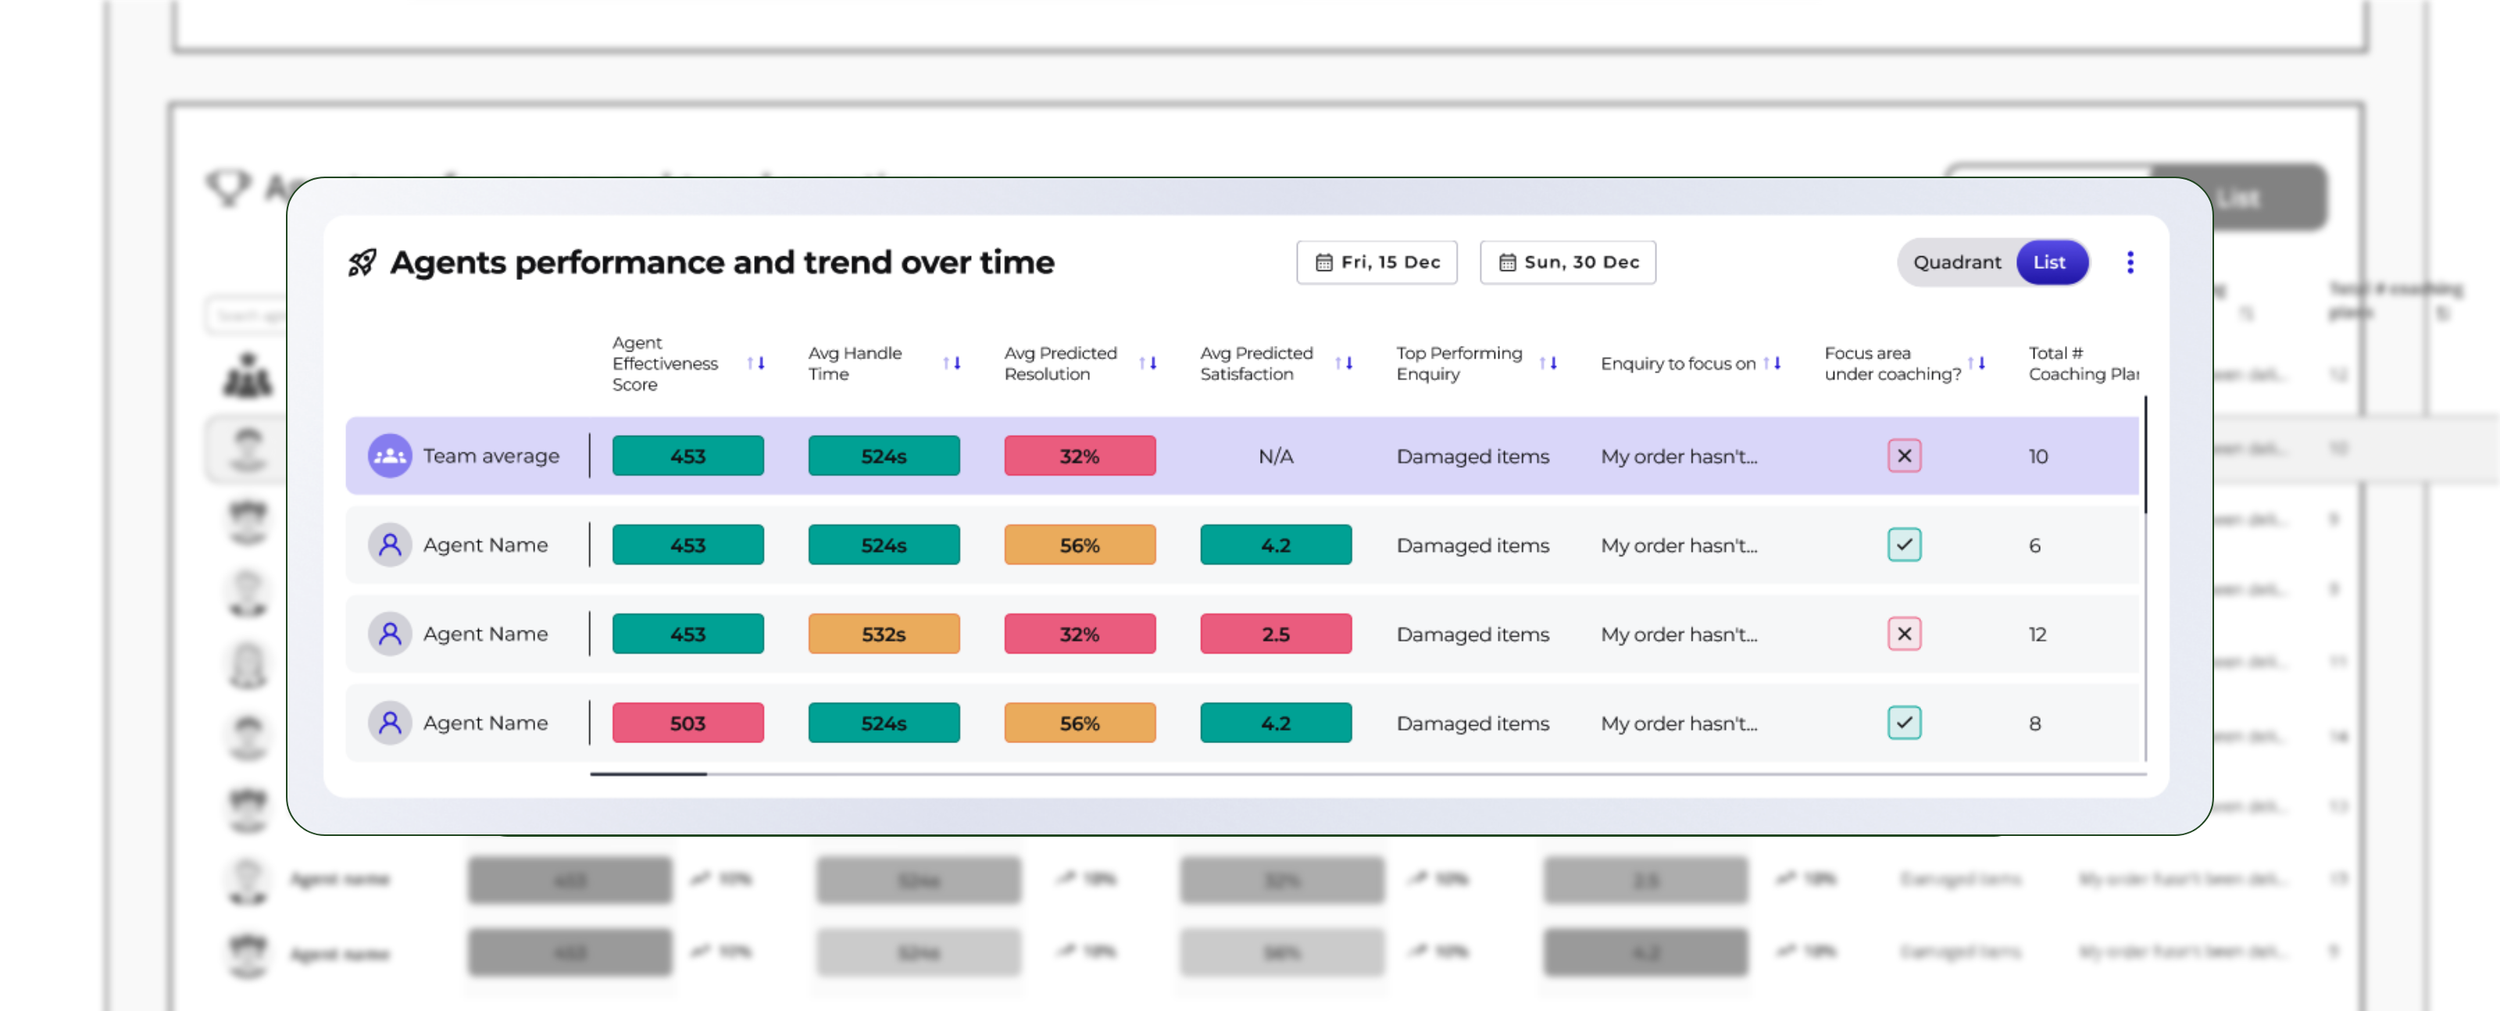
Insight: The Team Leader wants to view all the agents’ performance in the team with a time frame selection tool, and with their performance metrics colour coded.

Insight: The Team Leader wants to view clear statistics about their team (volume of calls, average score, how they are performing against other teams etc).
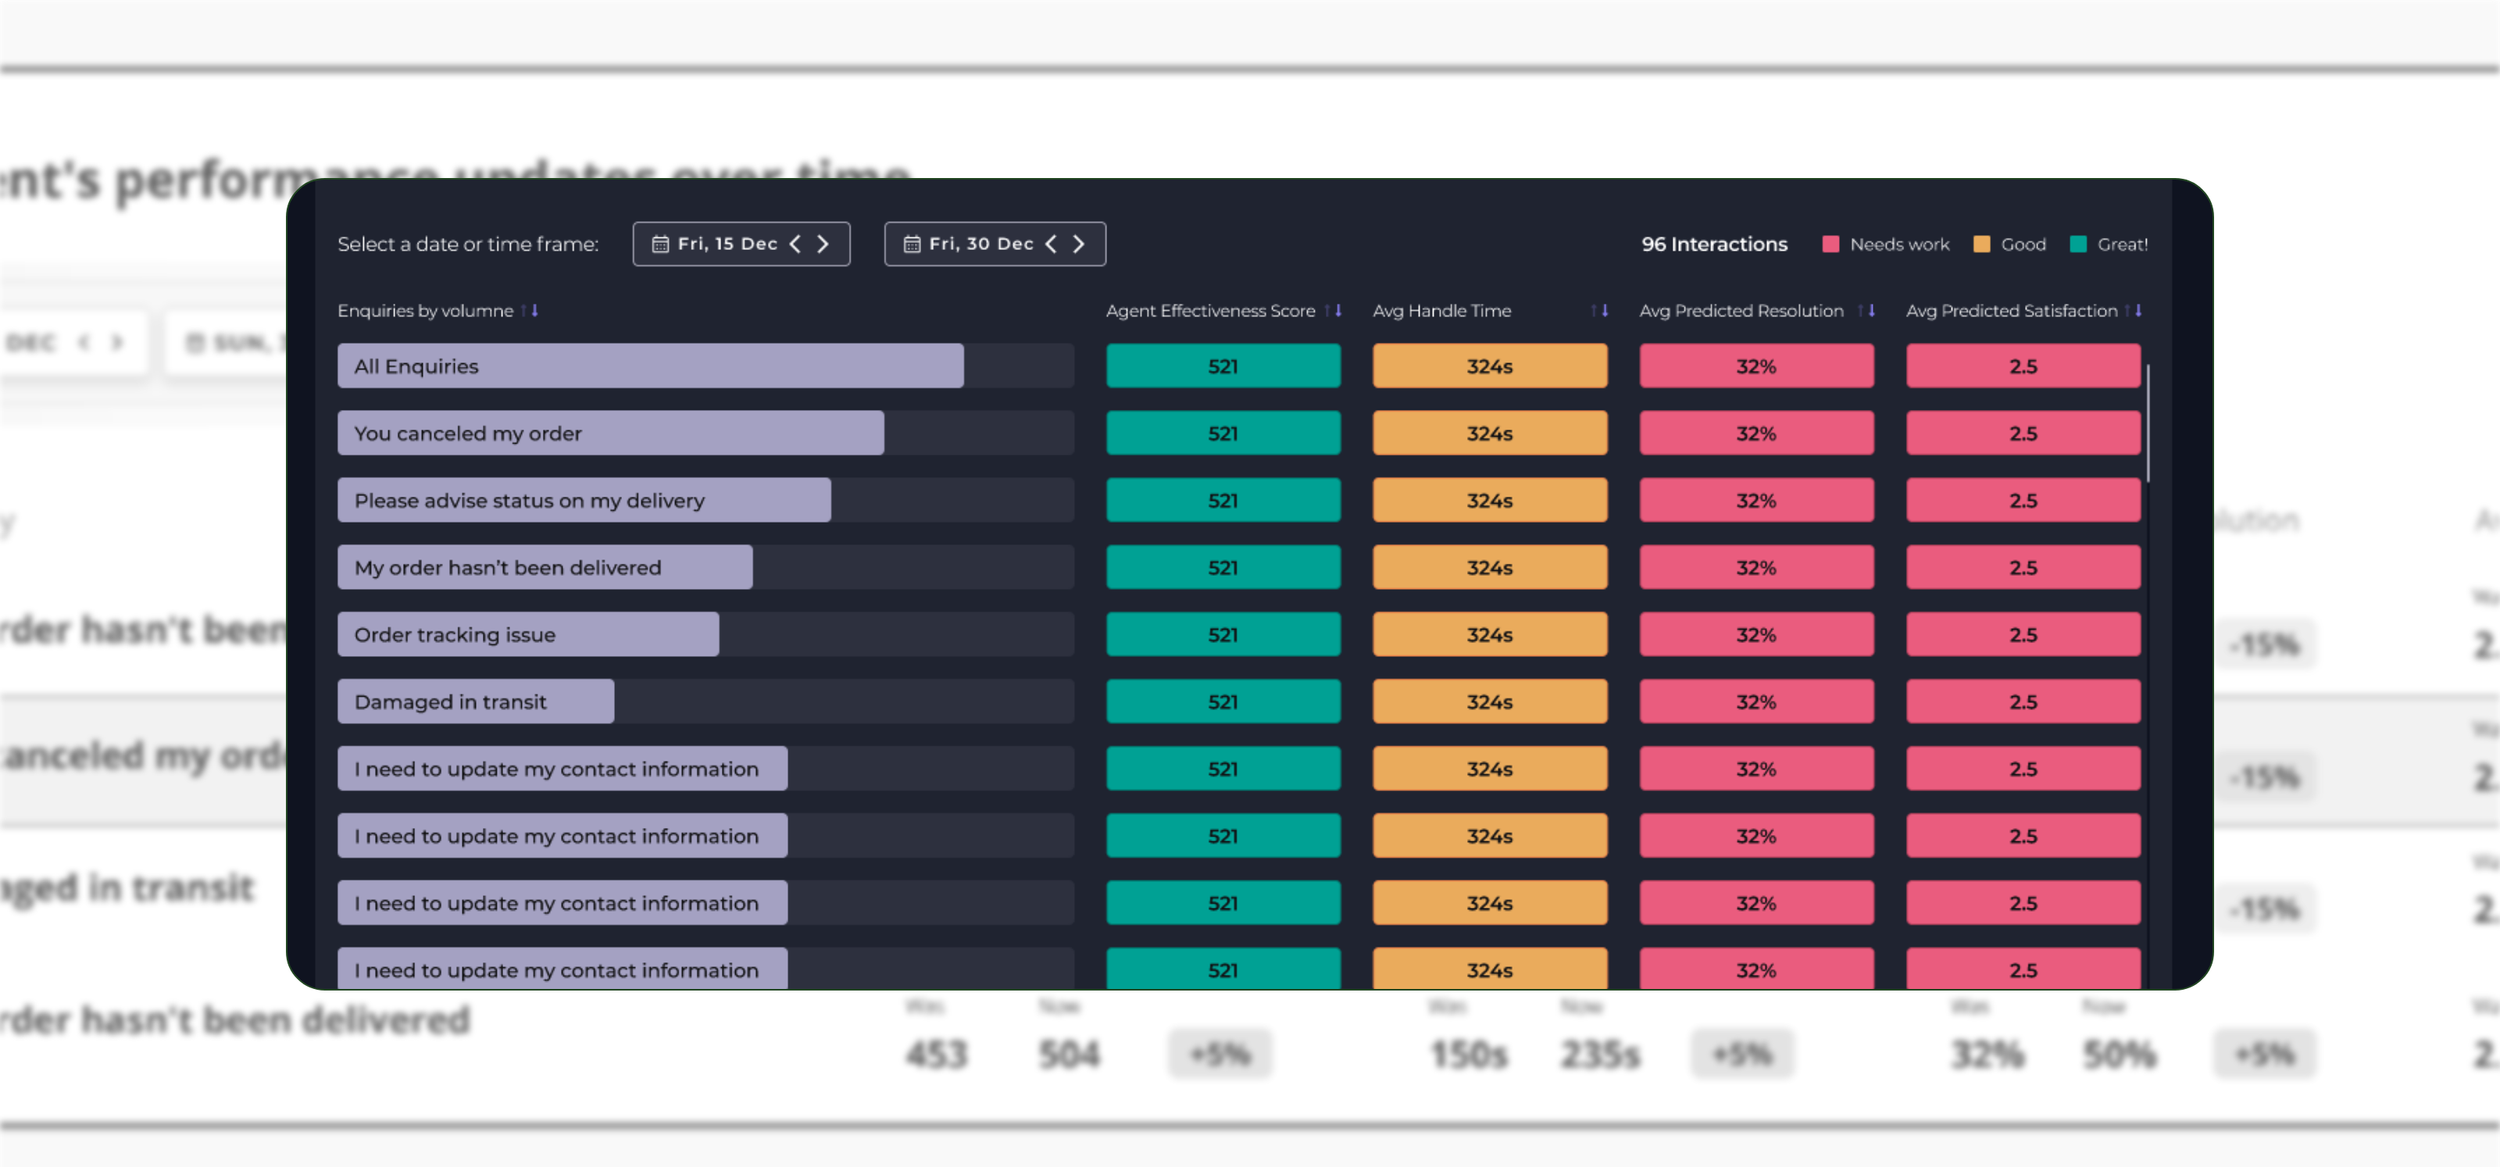
Insight: The Agent wants a clear overview of their performance and where they sit compared to the team. For each enquiry, they want to see which metric impacted the score.
